Let’s say you made the perfect Google Form to collect data, circulated it, and now you have some responses. That’s great, but now you need Google Forms data analysis. Quantifying Google Form results through a thorough and deep analysis of collected data can give you tangible insights that can lend you an edge in business.
In this post, we’ll cover analytics in Google Forms, and you’ll learn how to analyze Google Forms data that you’ve collected based on different question types. Let’s begin!
How to view analytics in Google Forms
Step 1: Open your form
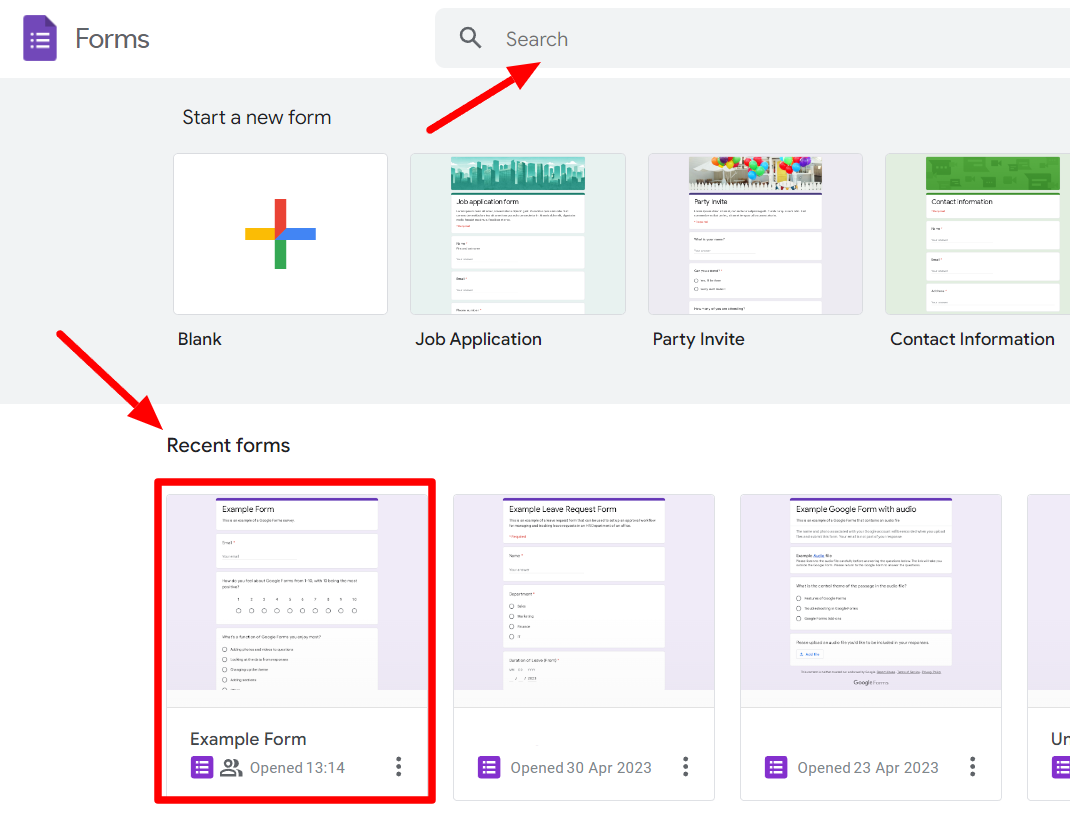
Navigate to your Google Forms. Once at the homepage, select the form you want to analyze under the recent forms section. If you don’t find your form there, you can also use the search field to enter the form's name and search for it directly.
Step 2: Go to the Responses tab
In your Google Form, next to the “Responses,” you’ll be able to view the number of responses your form has received. Toggle to the “Responses” tab from the “Questions” tab and you’ll see the Google Forms answer section.

Step 3: Choose to view your summary

Under the Responses tab, you’ll see three sections: Summary, Question, and Individual.
The result Summary section contains a summary of all the responses that your form has received so far. Under the Question tab, you can view the breakdown of results by question. If you want to learn how to view individual responses in Google Forms, the individual tab will show you the individual responses of all the form respondents.
The best way to get an overview of your Google Forms analytics is Summary, so we’ll go to that tab.
Step 4: Analyze your results
Analyzing your results provided by Google Forms is very easy, and Google Forms chooses the most appropriate format to display the results. Let’s break down the Summary for this form.
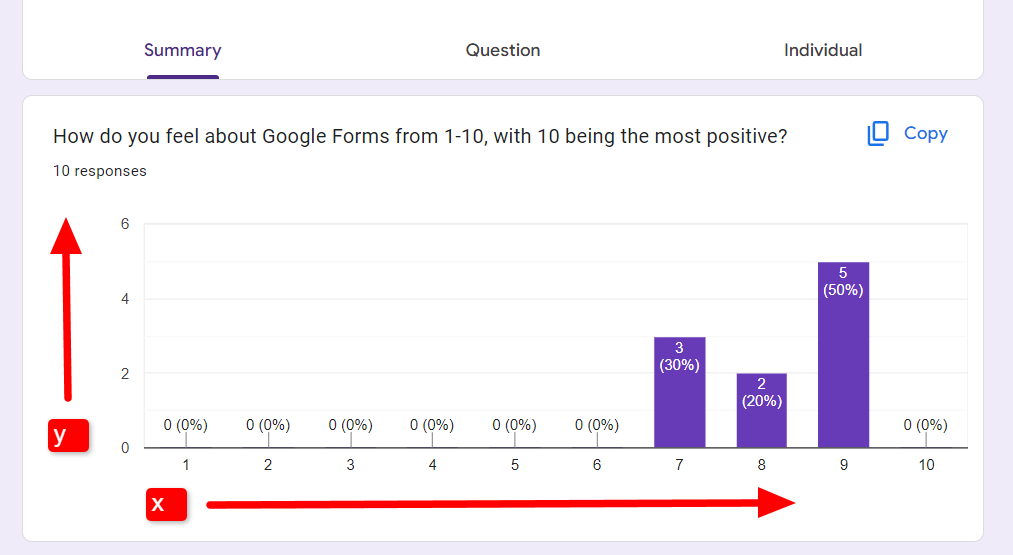
The first question in our example form is in linear scale format.

Its results are depicted on a bar graph on the Summary page. The X-axis represents the points on the linear scale, and the Y-axis represents the number of total responses. At the top of each point on the linear scale, you can see the number of responses and the percentage it forms of the total responses.
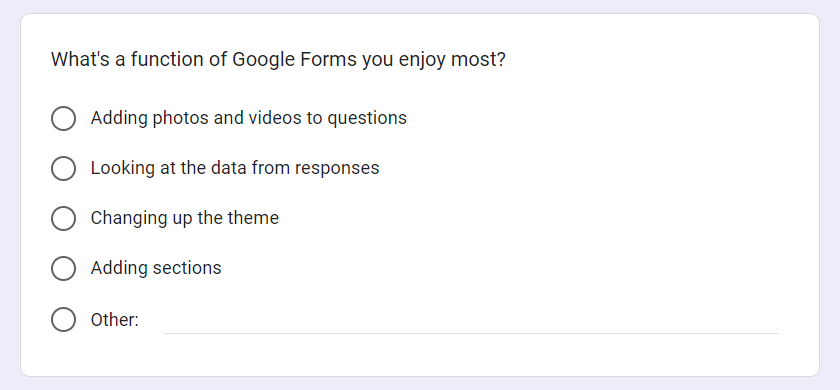
The next question is in the multiple-choice format on the form.
Google Forms depicts these responses in a pie chart format, and it’s pretty intuitive. On the left, you can see the total number of responses. On the right, it shows the different answer choices. The pie chart itself shows what percentage of responses chose each answer.
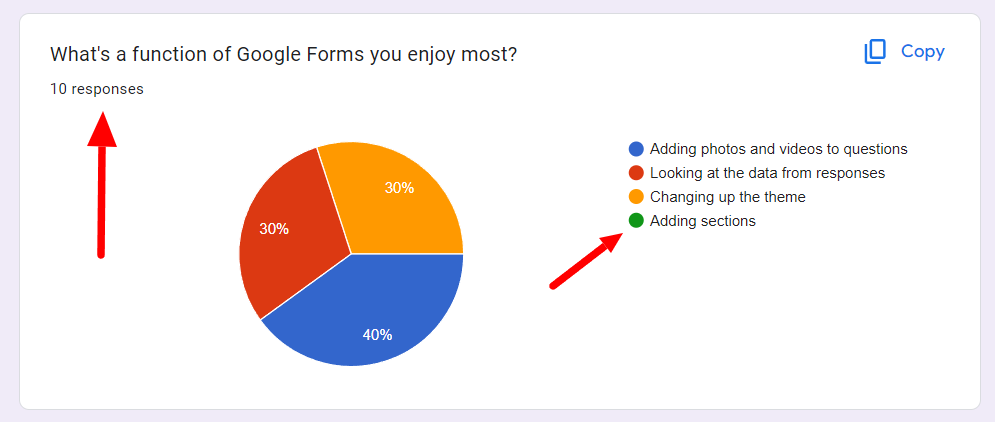
As you can see from the example above, the pie chart shows that out of the 10 responses, respondents chose between the first three answer options. It looks like nobody chose the last choice, “Adding sections.”
The last question is a descriptive question in the short paragraph question format.

Google Forms has simply listed all the answers to retain the integrity of individual subjective responses.
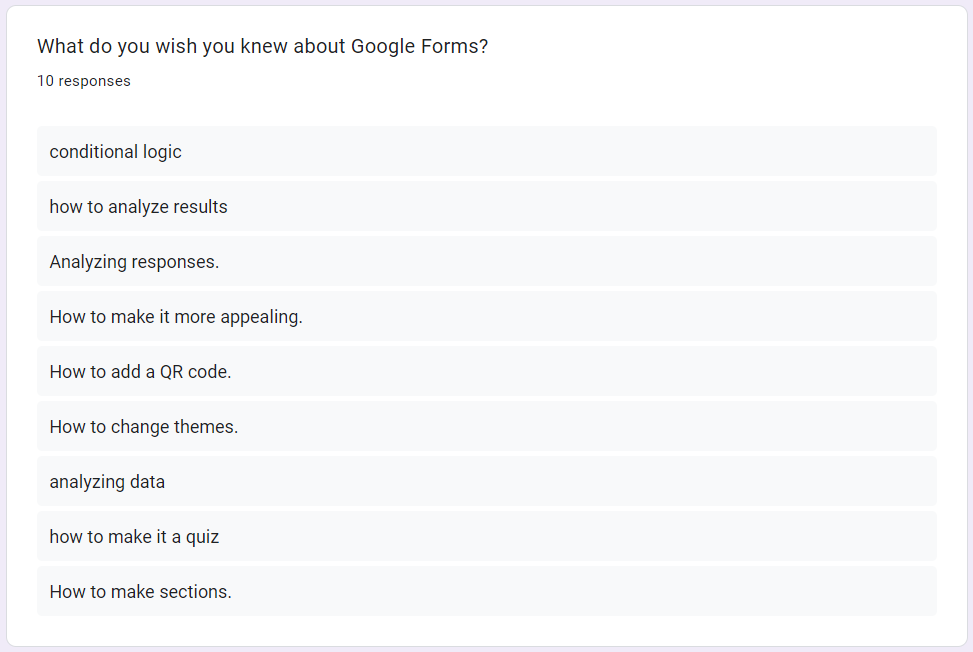
So that’s how you can analyze a Google Forms response summary page. It’s pretty easy and visual. Further, Google Forms automatically picks the correct format to depict responses in an easily understandable manner.
If you want to view your Google Forms responses in a Google Sheet, learn how in our tutorial.
Publish analytics in Google Forms with Form Publisher
So now you know how to view analytics on Google Forms. They offer a simple, intuitive way to observe responses. You can also view your responses on Google Sheets. However, if you need to publish your Google Forms responses for colleagues or for a presentation, you should use Form Publisher!
Form Publisher is a Google Forms add-on that automatically creates a document whenever someone fills in your form. You can use markers to customize templates and make personalized documents of different formats.Interested? Explore Form Publisher features.
